Tutorial
Explore and filter variants
Summarise a VCF file, keep the variants with enough quality and depth, and turn them into a readable table with bcftools. All in your browser.
What you will learn
- Summarise a VCF file with bcftools stats
- Filter variants by quality and read depth
- Extract chosen fields into a table with bcftools query
- Mark weak variants instead of removing them
The data
sample1.vcf: 12 variants in one sample against the PhiX174 genome (NC_001422.1), 11 single-base changes and one 3-base deletion. Eight have good quality and depth; four do not. The file is written for this tutorial, so you know which variants should pass.
Tools in this tutorial
- bcftools
- Works with variant files (VCF, BCF): filters variants, extracts fields into tables and summarises them.
Watch it first
The whole tutorial in under 2 minutes, recorded in the live app. The run is sped up.
Steps
- 01
Load the variants
Open the Workflow Builder at biochef.app. In File manager, upload
sample1.vcfand tick it for the Input node. New to the editor? The map reads tutorial shows each move with screenshots. - 02
Summarise the file
Search
statsand add Stats (BCFtools); connect the Input to it and add an Output. bcftools stats counts what is in the file before you change anything. - 03
Keep the reliable variants
Select the Input again and add Filter (BCFtools). Switch on include and type
QUAL>=30 && INFO/DP>=10: keep a variant only if its quality is at least 30 and at least 10 reads cover it.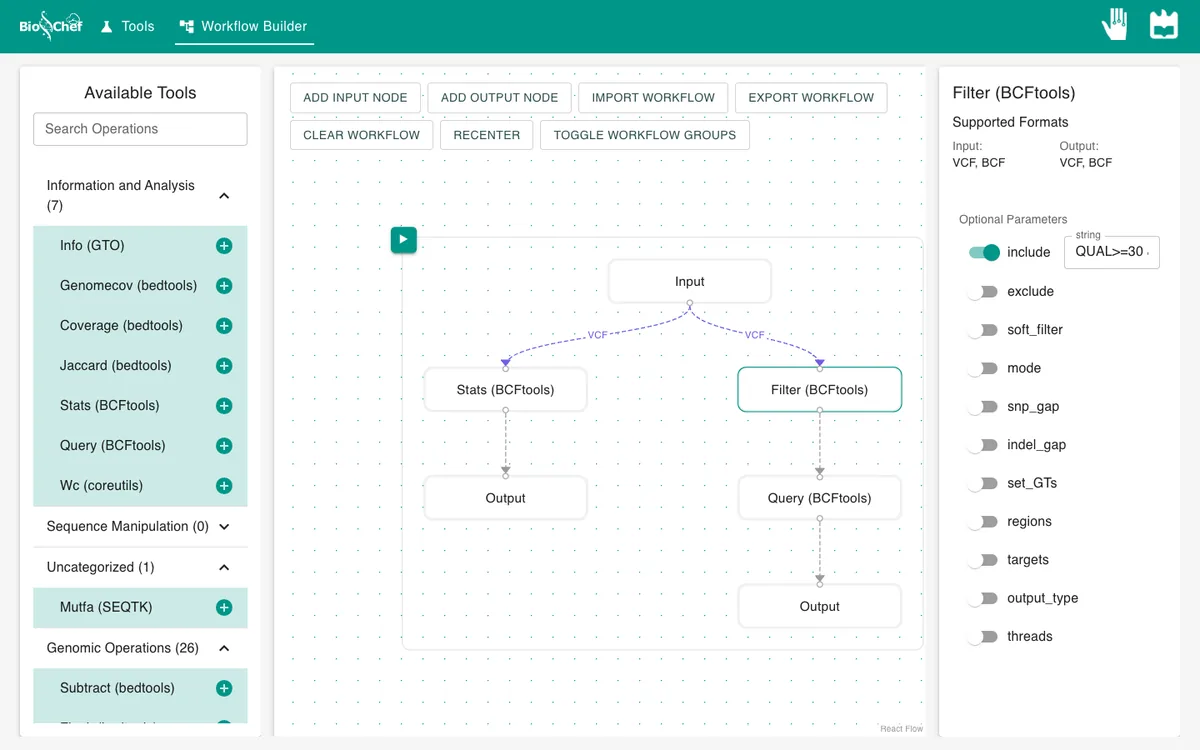
- 04
Turn them into a table
Add Query (BCFtools) after the filter. In its required format field type
%POS\t%REF\t%ALT\t%QUAL\t%INFO/DP\n: one line per variant with its position, reference and alternative bases, quality and depth, separated by tabs. Switch on print_header to label the columns, and add an Output.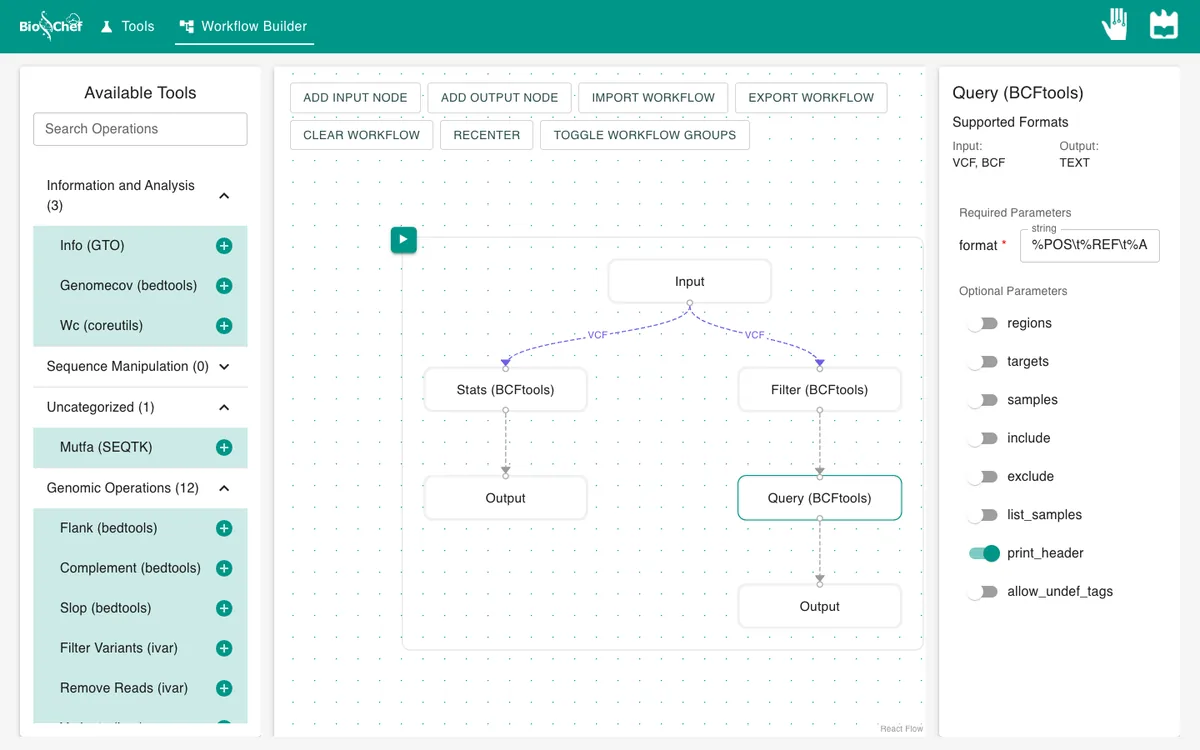
- 05
Run and compare
Press ▶. The Stats output describes all 12 variants; the table shows the ones that passed.
What you should see
# [1]POS  [2]REF  [3]ALT  [4]QUAL  [5]DP
150   A     G   58  34
612   G     A   62  31
1450  T     C   60  33
2201  T     C   57  29
3077  T     C   61  35
3400  TGCA  T   40  27
3999  C     T   59  30
4810  G     A   63  32
Stats reports 12 records: 11 SNPs and 1 indel. The filter keeps 8: seven SNPs and the deletion at 3400 (TGCA becomes T). The four that go fail on quality (positions 1088, 2650, 4400) or depth (1088, 1702, 4400).
Use the finished workflow
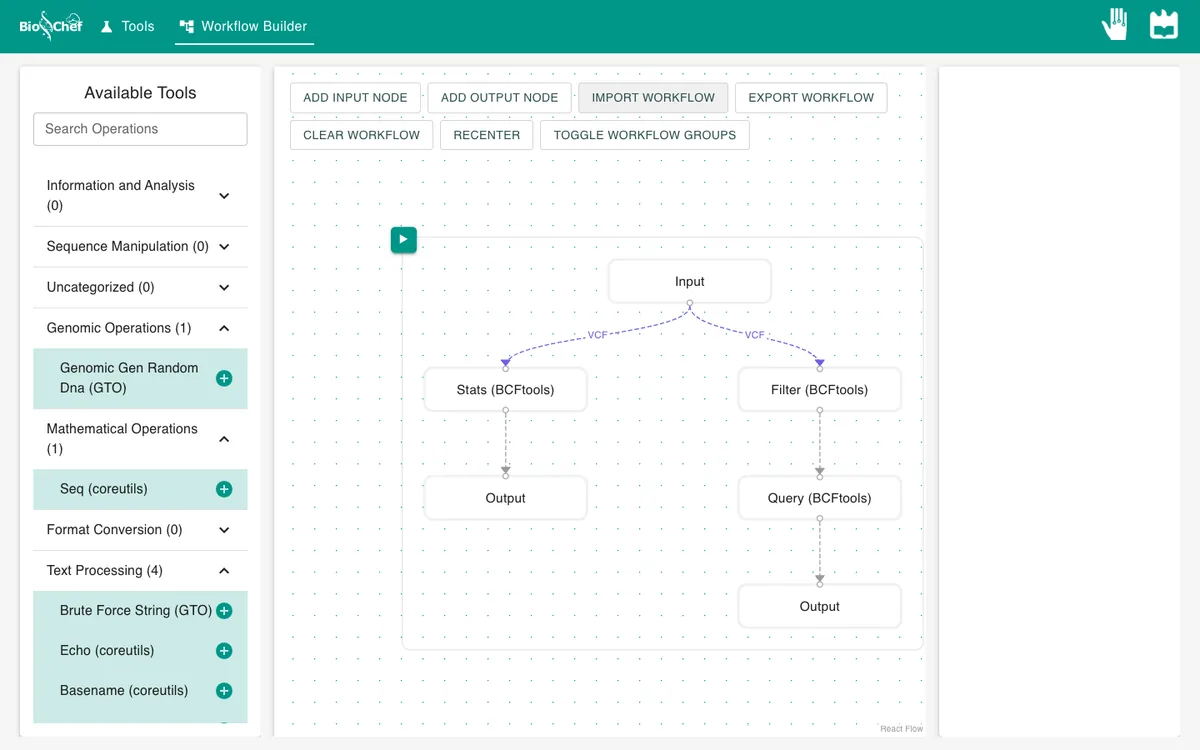
Import the finished workflow, data included, and press ▶. Remember that an exported workflow contains the data loaded in its Input nodes.
Exercise: mark weak variants instead of removing them
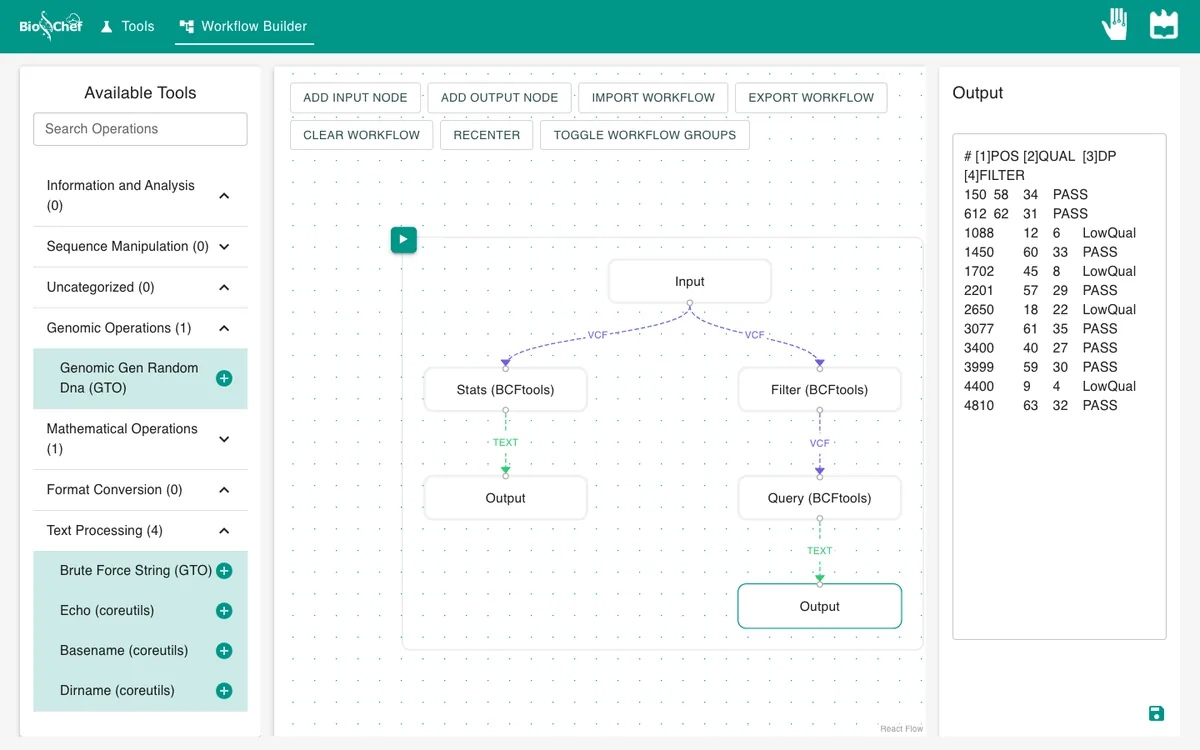
On the Filter node, switch include off, switch on exclude with QUAL<30 || INFO/DP<10 and soft_filter with LowQual. In Query, change the format to %POS\t%QUAL\t%INFO/DP\t%FILTER\n. All 12 variants stay, and the FILTER column says PASS or LowQual, so nothing is lost and anyone can see why.
From a test to a full run
The browser is the place to build and test a workflow on small data like this. For full datasets, the same workflow file is meant to run next to the data with the BioChef agent, which is in development. See Workflows for how the two fit together.
More tutorials: all BioChef tutorials.
This tutorial is licensed under CC BY 4.0. If you use BioChef in your work, please cite Rosa et al., BMC Bioinformatics 2026. BioChef is listed in bio.tools as biotools:biochef.